To mix things up a little, we will also share the results of polls conducted at the CeFPro Vendor & Third Party Risk conferences in New York and London last month, where we first launched the results of the survey. This gives us some additional interesting cross-Atlantic perspectives.
We’ll start with salary.
Salary Why salary? Well everyone’s at least a bit interested in what the benchmarks for their profession may be, and there’s a paucity of data on third party risk management compensation.
For some industries, notably banking, there’s also an expectation that compensation will be commensurate with the gravitas of the role. The OCC Bulletin 2017-7 Supplemental Examination Procedures for Third Party Relationships, states: “Banks should design compensation programsto attract and retain qualified personnel, align with strategy, and appropriately balance risk-taking and reward.”
While asking for annual salary figures is sensitive, salary can also be a leading indicator of maturity. Is third party risk management a valued function/role within the organization and does its compensation reflect this?
While the majority of the 211 survey respondents chose not to answer this question, 37 did, which provides an interesting sample to reference.
Respondents were asked their total salary (base, plus any bonus/ benefits) and the currency for the salary figure. This allowed us to convert and standardize to $US. This is fairly broad-brush and does not take into account variables such as city location, years of experience etc. which all play into salary outcomes. However, it is a starting point to learn from, and potentially draw some assumptions.
The survey revealed a range from $33,745 for a risk manager in Ghana to $725,000 for a director of vendor risk management in the US. The overall average was $155,106.
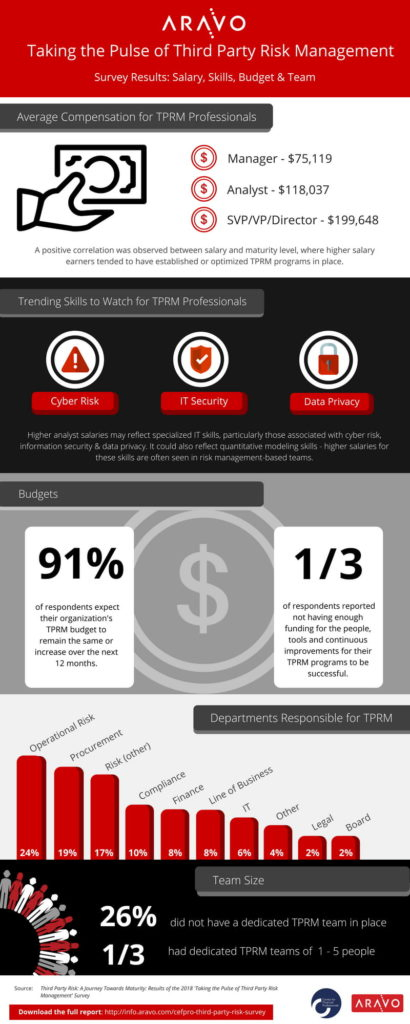
If you break it down by job levels, the average for a Manager was $75,119, which interestingly fell below Analysts at $118,037, with SVP/VP/Directors sitting on an average just shy of $200,000.
The strength of the analyst salary could reflect specialized IT skills, particularly those associated with the cyber risk, information security and data privacy domains. It could also reflect advanced quantitative modeling skills – higher salaries for these skills are often seen in risk management-based teams.
Some cross-Atlantic observations When we presented these results at the CeFPro Vendor & Third Party Risk conferences in New York and London last month, we were interested to discover whether these salary levels met the expectations of the audiences. So we asked them.
In New York, 32% found them higher than expected, 60% said that they were about in line with what they expected and 9% indicated that they were lower than they expected. (n=47). In London, 21% found them higher than expected, 71% said that they were about in line with what they expected and 8% indicated that they were lower than they expected. (n=63).
An interesting issue was raised at the London event, where one of the delegates pointed out that the pool of third party risk specialists with cyber-risk expertise was small. He indicated that individuals with this skill-set tended to move from company to company, commanding higher pay with each move. This was spiraling up costs and churn associated with these roles, making them increasingly difficult to fill.
Level of funding In the survey we also asked about resourcing. Respondents were asked whether, on a scale of 1-5 (1 being fully agree to 5 being fully disagree), they considered their third party risk management program had the appropriate level of funding to support the people, tools and innovation required for success.
Around a third of respondents did not believe they were adequately funded across all three categories.
GLOBAL SURVEY RESULTS
32% did not feel they were adequately funded for people (strongly disagree/disagree)
33% did not feel they were adequately funded for (strongly disagree/disagree)
32% did not feel they were adequately funded for innovation/ continuous (strongly disagree/disagree)
We asked the same question of attendees at the CeFPro events.
NEW YORK CONFERENCE AUDIENCE POLL RESULTS
27% did not feel they were adequately funded for people
44% did not feel they were adequately funded for tools
41% did not feel they were adequately funded for innovation/ continuous improvement
LONDON CONFERENCE AUDIENCE POLL RESULTS
40% did not feel they were adequately funded for people
52% did not feel they were adequately funded for tools
48% did not feel they were adequately funded for innovation/ continuous improvement
Budget It is often said that the sign of a mature function in an organization is one that has its own budget responsibilities. In that sense, TPRM still has some way to evolve. Nearly four in 10 respondents to the survey did not know what their TPRM budgets (outside headcount) were.
Of those who did know what their budget was, almost half (49%) had budgets less than $50,000, 10% had budgets between $50,000-100,000 and 41% had budgets over $100,000.
However, there were some relatively well-funded organizations, with 20% indicating that their budgets were in excess of $1million.
When considering investments required – for technology, third party risk intelligence content as well as audit – these budgets appear low, although conceivably these expenses could fall in other budget lines across the organization, such as IT and information management.
Overall, there was some relatively good news as far as budgets were concerned, with 91% of respondents expecting budgets to increase or remain the same in the next 12 months.
6% expect budgets to increase significantly
35% expect budgets to increase slightly
50% expect budgets to remain the same
8% expect budgets to decrease slightly
1% expect budgets to decrease significantly
Given the margin pressures that many organizations – and in particular financial services firms – remain under, this level of financial focus on TPRM underscores the importance the discipline is beginning to attain.
Team size Team size varied quite significantly. More than one-quarter (26%) of respondents said they did not have a dedicated TPRM team in place. It is possible that organizations who said they did not have a dedicated team in place spread TPRM responsibilities across the corporate structure, assigning them to individuals who have other responsibilities as well.
One third (33%) had third party risk teams of between 1-5 people, 14% had teams of 6-10, 10% had teams of 11-20, 6% had teams of 21-30, 3% had teams of 31-50 and 8% had teams of more than 50.
The survey report takes a closer look at the impact of the size of the organization and the maturity of the organization on team size.
Next week In next week’s blog, we’ll explore some of the challenges and opportunities ahead for third party risk management – in the words of the respondents themselves.
 Ensure your third parties align to your information security data, privacy, and network security requirements